
Automated Sports Recap Video: One Card for Every Fixture
Render a full-time scorecard from a league feed, not from footage. One card per fixture, 26 fields, one credit, published before anyone opens an editor.
A full-time card is a result, not a highlight reel. Map a league feed onto 26 named fields, POST one request when the final whistle fires, and the recap is published before an editor has opened the footage. Each 37-second card costs one credit.
The finished video
This guide renders Sports Match Recap - Full-Time Scorecard - a 37-second 16:9 card in seven scenes: a Full Time cold open with both crests, the scoreline, a goalscorers page, a head-to-head stats panel, a player of the match spotlight, a next-fixture tease, and a sign-off.
Twenty-six fields change per fixture, driving 89 overlays. Some fields work
harder than others: home_crest is used seven times across the seven scenes and
match_photo five, so one URL each fills the whole card.
What you need
- A Renderly API key. Create one in the dashboard under Settings → API keys.
- A results feed or a
match.finishedwebhook from whatever runs your fixtures. - A crest image per team and one venue photograph, at URLs that serve the file directly.
Step 1 - Decide whether you are cutting footage or publishing a result
Search this query and you get highlight detection: Pixellot, Spiideo, Magnifi, Eklipse. They point computer vision at match video, find the goals, and cut a reel. That is a real product and it is not this one.
The difference is what the pipeline consumes. A highlight tool consumes footage, which means a camera rig at the venue, an operator or an install per pitch, and a per-match cost that does not fall as you add fixtures. A card consumes the result, which arrives as JSON from the same system that already publishes your league table.
So the question is not which is better, but which one runs for every fixture. A federation with 400 matches a weekend has 400 results and maybe twelve camera rigs: the cards cover all 400, the reels cover twelve.
Step 2 - Map the league feed onto the fixture card
The 26 fields are grouped the way a feed row already is:
| Group | Fields |
|---|---|
| Fixture | competition_label, match_round, venue_label, match_photo |
| Teams | home_team_name, away_team_name, home_crest, away_crest |
| Result | home_score, away_score, home_scorers, away_scorers |
| Stats | stat_1_label / _home / _away, and the same for 2 and 3 |
| Spotlight | motm_name, motm_line |
| Next | next_opponent_name, next_opponent_crest, next_match_label |
Two of these need formatting rather than copying. home_scorers is one string
carrying every goal, with a newline between them and the minute first. And
motm_name is set at 150px in a 920x300 box, which is two lines, so break the
name yourself: the sample ships "Vinícius\nJr" rather than trusting the
layout to find the space.
Watch the team names too. They render at four sizes across the card, and the smallest box is 360px wide at 50px Anton on the stats scene. A club whose name fits the scoreline can still clip there, so test your longest name, not your first one.
Step 3 - Cap the goalscorer lines before the feed writes them
Each scorers panel is 760x360 at 52px Oswald on a 1.7 line height. That is 88 pixels a line and room for four:
{
  "home_scorers": "23'   Rodrygo\n45+2'   Raphinha\n78'   Vinícius Jr",
  "away_scorers": "67'   Mbappé"
}Three lines is comfortable, four is the ceiling, and a fifth is sheared off while the render reports success. Decide the rule in the mapping function before a 6-1 decides it for you.
Step 4 - Make the stat bars tell the truth
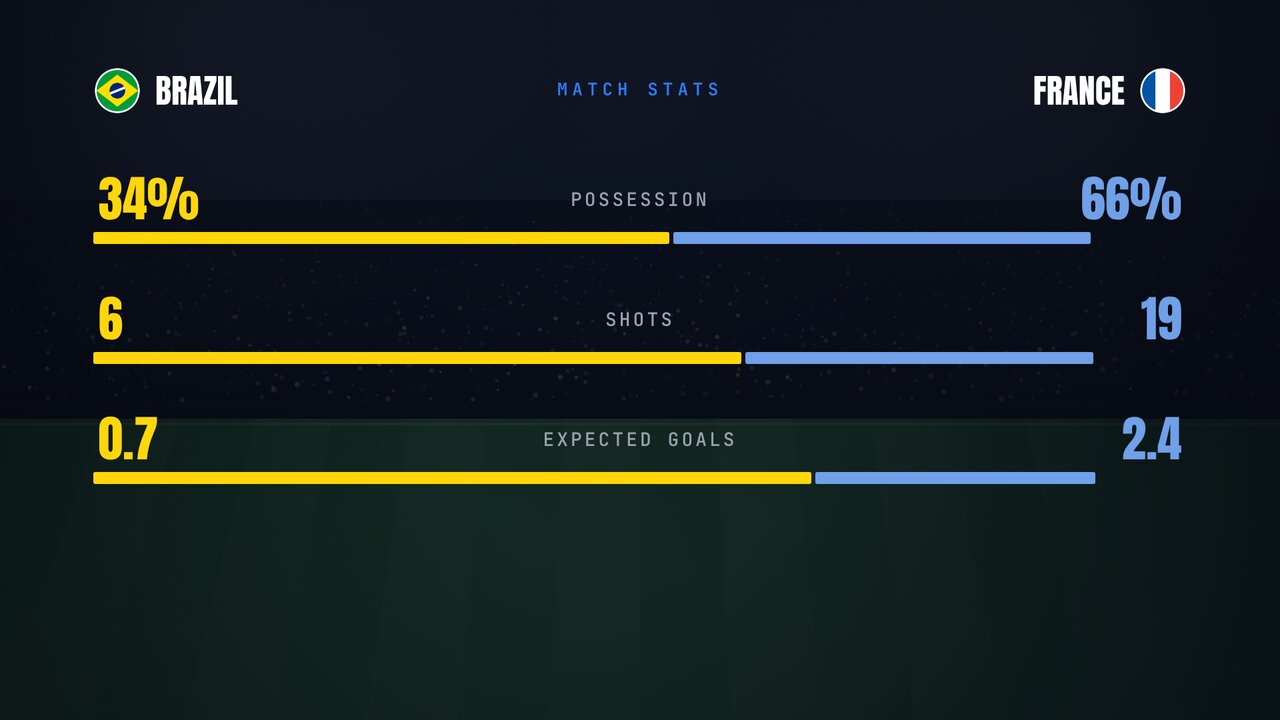
This is the one that will embarrass you in public. The stats scene draws six dueling bars, and they are static shape overlays, not values. Their widths are baked to the sample fixture:
| Row | Bar widths | Implied split | Sample figures |
|---|---|---|---|
| 1 | 864 / 626 | 58 / 42 | Possession 58% / 42% |
| 2 | 972 / 522 | 65 / 35 | Shots 17 / 9 |
| 3 | 1077 / 420 | 72 / 28 | Expected Goals 2.8 / 1.1 |
Send stat_1_home: "34%" and stat_1_away: "66%" and the printed figures
change while the bars do not. The card then shows the away side dominating the
number and the home side dominating the bar, in the same row:
Two honest ways out. Pick three stats whose ratios sit near the sample's and
treat the bars as decoration, or send the composition as inputProps instead of
replacements and set the six widths yourself. The API takes inputProps,
projectId or templateId, so that escape hatch costs only the convenience of
named fields.
Step 5 - Render one card per fixture on the final whistle
One finished fixture becomes one POST. The template's API id is
football-recap; sports-match-recap is only the gallery URL.
curl -X POST https://renderly.video/api/v1/renders \
  -H "Authorization: Bearer $RENDERLY_API_KEY" \
  -H "Content-Type: application/json" \
  -d '{
    "templateId": "football-recap",
    "replacements": {
      "competition_label": "World Cup 2026",
      "match_round": "Group Stage · Matchday 3",
      "venue_label": "MetLife Stadium · New York / NJ",
      "home_team_name": "Brazil",
      "away_team_name": "France",
      "home_score": "3",
      "away_score": "1",
      "home_scorers": "23'\''   Rodrygo\n45+2'\''   Raphinha\n78'\''   Vinícius Jr",
      "away_scorers": "67'\''   Mbappé",
      "stat_1_label": "Possession",
      "stat_1_home": "58%",
      "stat_1_away": "42%",
      "motm_name": "Vinícius\nJr",
      "motm_line": "2 Goals · 1 Assist",
      "next_opponent_name": "Mexico",
      "next_match_label": "Saturday · July 4"
    },
    "webhookUrl": "https://your-app.com/hooks/renderly"
}'Any field left out keeps the template's default, which on this card means
shipping the sample's crest or the sample's venue. That matters more here than
elsewhere: a missing away_crest does not fail, it publishes the wrong flag.
Validate the row before the request, not the file after it.
The call returns a job ID immediately and the finished URL arrives on the
render.completed webhook, signed with HMAC-SHA256; the
webhooks guide covers verifying
it.
What this costs at scale
Renderly bills 1 credit per minute of 1080p output, rounded up to the nearest half credit. A 37-second card rounds to one credit.
| Cards per month | Credits | Plan |
|---|---|---|
| 8 - one club, two fixtures a week | 8 | Creator, $29/mo |
| 40 - a ten-team league, every fixture | 40 | Creator, $29/mo |
| 200 - 50 fixtures a weekend | 200 | Creator, $29/mo |
| 300 - 75 fixtures a weekend | 300 | Business, $99/mo |
| 1,000 - a federation at 250 a weekend | 1,000 | Business, $99/mo |
A 20-team league playing 380 fixtures a season spends 380 credits on the whole season, spread across nine months at about 42 a month, which never leaves the $29 plan. At roughly fifteen cents a card the rendering is not the constraint - the feed is.
Where to go next
The same shape appears wherever a feed fires an event and a card follows. The daily news brief runs it on a clock instead of a whistle, and the CSV guide has the resumable loop you want for backfilling a season that has already been played.
Frequently asked
Does Renderly cut highlights out of match footage?
What happens when a team scores five?
Do the stat bars move with the numbers?
Is there a version for basketball?
How do I backfill a season that has already been played?
Related guides
Automated News Video Generation: One Edition Every Morning
Render a daily news and weather brief from feeds instead of from a script. One edition a morning, 26 fields, one credit, and nothing to review before it ships.
Bulk Video from CSV: Generate One Video per Row
Turn a CSV export into finished videos. Map headers to template variables, send one render request per row from a resumable script, and collect every result.